Cortex-M JTAG Debugging
Introduction
This article describes how to debug firmware running on Cortex-M cores using JTAG and SEGGER J-Link hardware.
The following Toradex hardware platforms are supported:
- Apalis iMX8 with Apalis Evaluation Board
- Colibri iMX8X with Colibri Evaluation Board
- Verdin iMX8M Mini and Verdin iMX8M Plus with Verdin Development Board or Dahlia Carrier Board
This article complies with the Typographic Conventions for Toradex Documentation.
Prerequisites
-
Hardware prerequisites
- A supported Toradex module and carrier board
- Access to the U-Boot console
- Access to the alternative core serial console
- SEGGER J-Link hardware: the J-Link hardware version used in this guide is v10.1
-
Software prerequisites:
- The MCUXpresso SDK and all required tools configured. Refer to the Setting Up the MCUXpresso SDK and Toolchain for HMP Development article for more information about the installation process
- Make sure to add the toolchain folder to the Linux PATH and to export the LD_LIBRARY_PATH
- A
hello_worldexample firmware binary, as described in the How To Compile Firmware for Alternative Cores (NXP) article
- The MCUXpresso SDK and all required tools configured. Refer to the Setting Up the MCUXpresso SDK and Toolchain for HMP Development article for more information about the installation process
Install the J-Link Software and GDB Server
To install the J-Link Software and GDB Server, follow the steps below:
-
Install dependency packages:
Recent operating systems don't include the required Python 3.6 development libraries for the GDB server. To compile it manually, select a folder to install the library and run the following commands:
$ cd ~
$ export PREFIX=/home/$USER/python3.6
$ wget https://www.python.org/ftp/python/3.6.14/Python-3.6.14.tgz
$ tar xf Python-3.6.14.tgz
$ mkdir -p $PREFIX && cd $PREFIX
$ ~/Python-3.6.14/configure --prefix=$PREFIX --enable-shared
$ make -j$(nproc)
$ make install
After the manual installation, run the following command to check if the shared library was compiled successfully:
$ find . -name libpython3.6m.so.1.0
./libpython3.6m.so.1.0
./lib/libpython3.6m.so.1.0
Finally, export the library path:
$ export LD_LIBRARY_PATH=$LD_LIBRARY_PATH:/home/$USER/python3.6/lib -
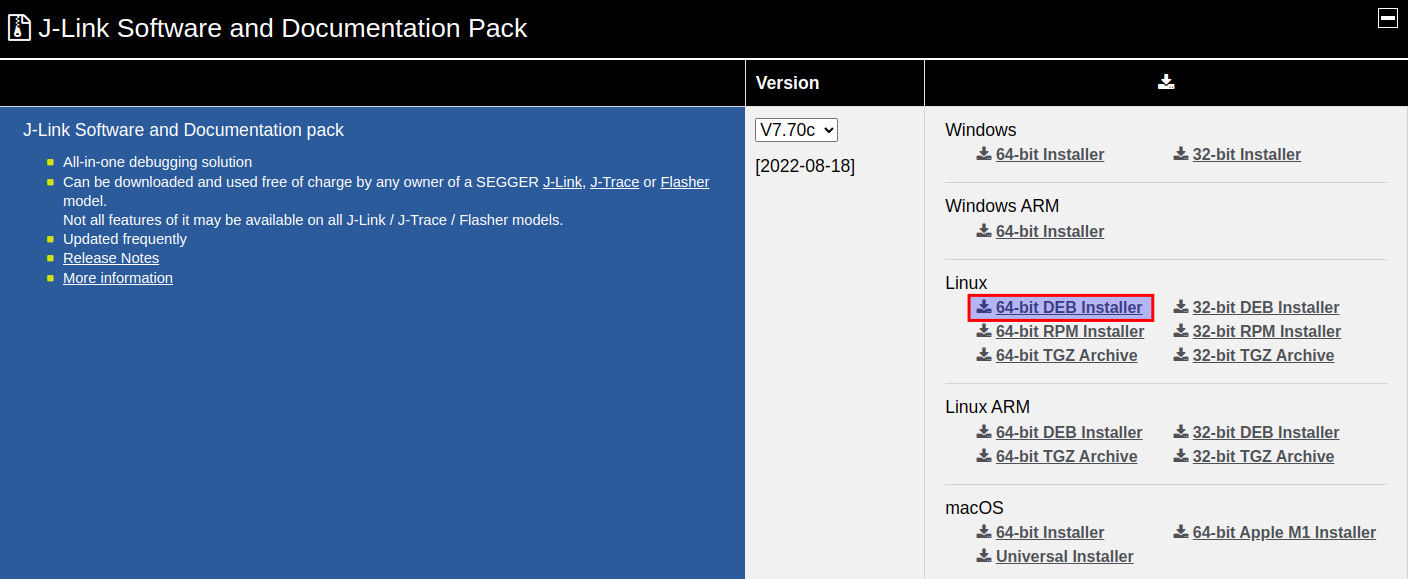
Download the J-Link Software from Segger website: J-Link Software and Documentation Pack
infoThis article assumes a Linux host. Other host operating systems may also work as expected, but are not covered here.
-
Install the J-Link Software:
$ sudo apt install ./JLink_Linux_<PACKET_VERSION>.deb
JTAG Debug for Cortex-M
Compiling the firmware image generates the hello_world.elf file, which should be used for debugging instead of the hello_world.bin file. After compiling the firmware image, boot the target module and access the U-Boot terminal to set up the JTAG connection.
Run the Debugger
-
Connect the J-Link to your board using the JTAG connector. Refer to the table below for the pinout and connection details for each module:
Carrier Board JTAG Connector Apalis Evaluation Board X33 Colibri Evaluation Board X13 Dahlia Carrier Board X8 Verdin Development Board X56 dangerDo not use the on-board debugger and an external JTAG debugger at the same time. Before connecting an external JTAG debugger, configure the board as follows:
- Dahlia Carrier Board: jumper JP6 must be connected. For more information, refer to Section 2.17 of the Dahlia Carrier Board Datasheet.
- Verdin Development Board: jumpers X67A through X67F must be removed. For more information, refer to Section 2.21 of the Verdin Development Board Datasheet.
Simultaneous use of the on-board debugger and an external JTAG debugger may damage the debuggers or the carrier board.
-
After connecting the J-Link to the board, run the J-Link GDB Server:
$ JLinkGDBServer -if JTAG -device MIMX8ML8_M7$ JLinkGDBServer -if JTAG -device MIMX8MM6_M4$ JLinkGDBServer -if JTAG -device MIMX8QX6_M4 -vd -xc mekmimx8qx_gdbsrv.cfginfoThe
mekmimx8qx_gdbsrv.cfgfile is available underSDK_2.x.x_<board>/boards/<board_name>/demo_apps/hello_world/armgccdirectory.$ JLinkGDBServer -if JTAG -device MIMX8QM6_M4_0infoUse
MIMX8QM6_M4_1to debug the secondary Cortex-M4 core on the Apalis iMX8 module. -
After initializing the JLinkGDBServer, connect to the target module and run the
hello_worldapplication using thearm-none-eabi-gdbtool from the MCUXpresso SDK:$ arm-none-eabi-gdb hello_world.elf
GNU gdb (GNU Toolchain for the Arm Architecture 11.2-2022.02 (arm-11.14)) 11.2.90.20220202-git
Copyright (C) 2022 Free Software Foundation, Inc.
License GPLv3+: GNU GPL version 3 or later <http://gnu.org/licenses/gpl.html>
This is free software: you are free to change and redistribute it.
There is NO WARRANTY, to the extent permitted by law.
Type "show copying" and "show warranty" for details.
This GDB was configured as "--host=x86_64-pc-linux-gnu --target=arm-none-eabi".
Type "show configuration" for configuration details.
For bug reporting instructions, please see:
<https://bugs.linaro.org/>.
Find the GDB manual and other documentation resources online at:
<http://www.gnu.org/software/gdb/documentation/>.
For help, type "help".
Type "apropos word" to search for commands related to "word"...
Reading symbols from hello_world.elf...
(gdb) -
After loading the GDB server and connecting to the target module, run the following commands to load the firmware and start debugging:
(gdb) target remote localhost:2331
(gdb) monitor reset
(gdb) monitor halt
(gdb) load(gdb) target remote localhost:2331
(gdb) monitor reset
(gdb) monitor halt
(gdb) load(gdb) target remote localhost:2331
(gdb) load hello_world.elf(gdb) target remote localhost:2331
(gdb) monitor reset
(gdb) monitor halt
(gdb) load -
Finally, the application is now downloaded and halted at the reset vector. It is possible to start the demo application by running the
monitor gocommand or to run the firmware step by step using thestepcommand, as shown below:(gdb) step
(gdb) monitor goAs a result, the "hello world." message successfully appears on the alternative core debug terminal:
hello world.
Next Steps
Follow the HMP RPMsg Guide article to learn how to use the Remote Processor Messaging (RPMsg) protocol for communication between the alternative and main cores.