Remote Deploy and Debug Projects
Introduction
This article presents instructions on remotely deploying and debugging projects on your target device. With the Torizon IDE Extension, you can troubleshoot applications running on a SoM directly from your host machine by adding breakpoints to the source code in Visual Studio Code.
Starting a debugging session triggers some IDE extension tasks. Those tasks build and run the container application with configurations that enable remote debugging via SSH. We refer to this container as a "debug container". If you need a container built with only the essentials for the application - referred to as a "release container", see Build, Test and Push Applications for Production.
Prerequisites
- Having understood the basics of Torizon IDE Extension.
- Toradex System on Module (SoM) with Torizon OS installed.
- Having created a single-container project.
Remote Debug and Deploy
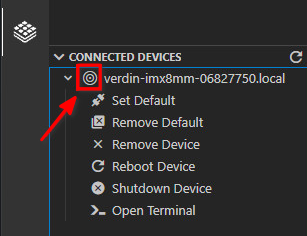
Check if the desired device is set as the default.
To differentiate between the registered devices and the default device, look for the following highlighted icon:
Check if the recommended extensions are installed: All templates include a file named
.vscode/extensions.json, which specifies a list of recommended extensions for the project. These extensions commonly will add the LSP (language server protocol) support for the project language, syntax highlight, code formatting, debugger, etc.Open the Command Palette(
Ctrl+Shift+P).Type
Extensions: Show Recommended Extensions. Select it.It will open the Extensions menu and show the list of recommended extensions.
Install all by clicking the
Install Workspace Recommended Extensionsicon.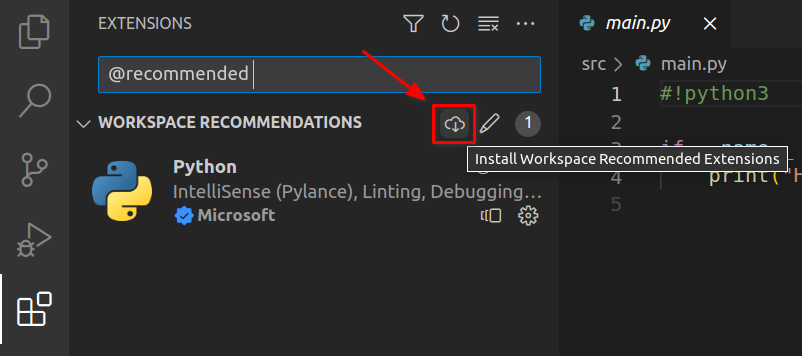
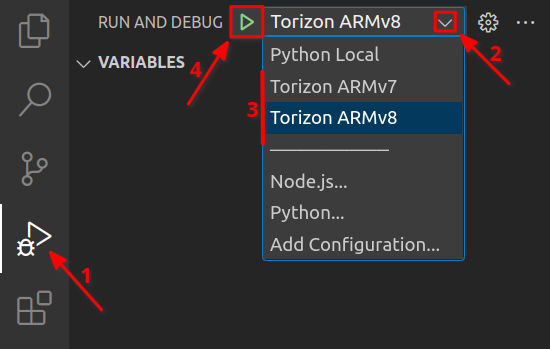
Start the debug session:
Click the
Run and Debug (Ctrl+Shift+D)icon in the VS Code left menu bar.Select the option that matches the architecture of your default target device:
Torizon ARMv8: for ARM 64 bit devices.Torizon ARMv7: for ARM 32 bit devices.
Click the
Start Debuggingicon (or pressF5).
 info
infoOnce you have selected one architecture option, VS Code will use it as the default option for the next debugging sessions. So, the next time you want to debug your project, just press
F5, and VS Code will automatically run from the last selected architecture.The remote deployment and debugging process will start. Wait until the end of the process. VS Code will automatically change to the Debug Console tab, which displays the output logs of the debugger and application.
Also, you can follow the build/deploy progress by looking at the VS Code window footer and task tabs, as the following image highlights.
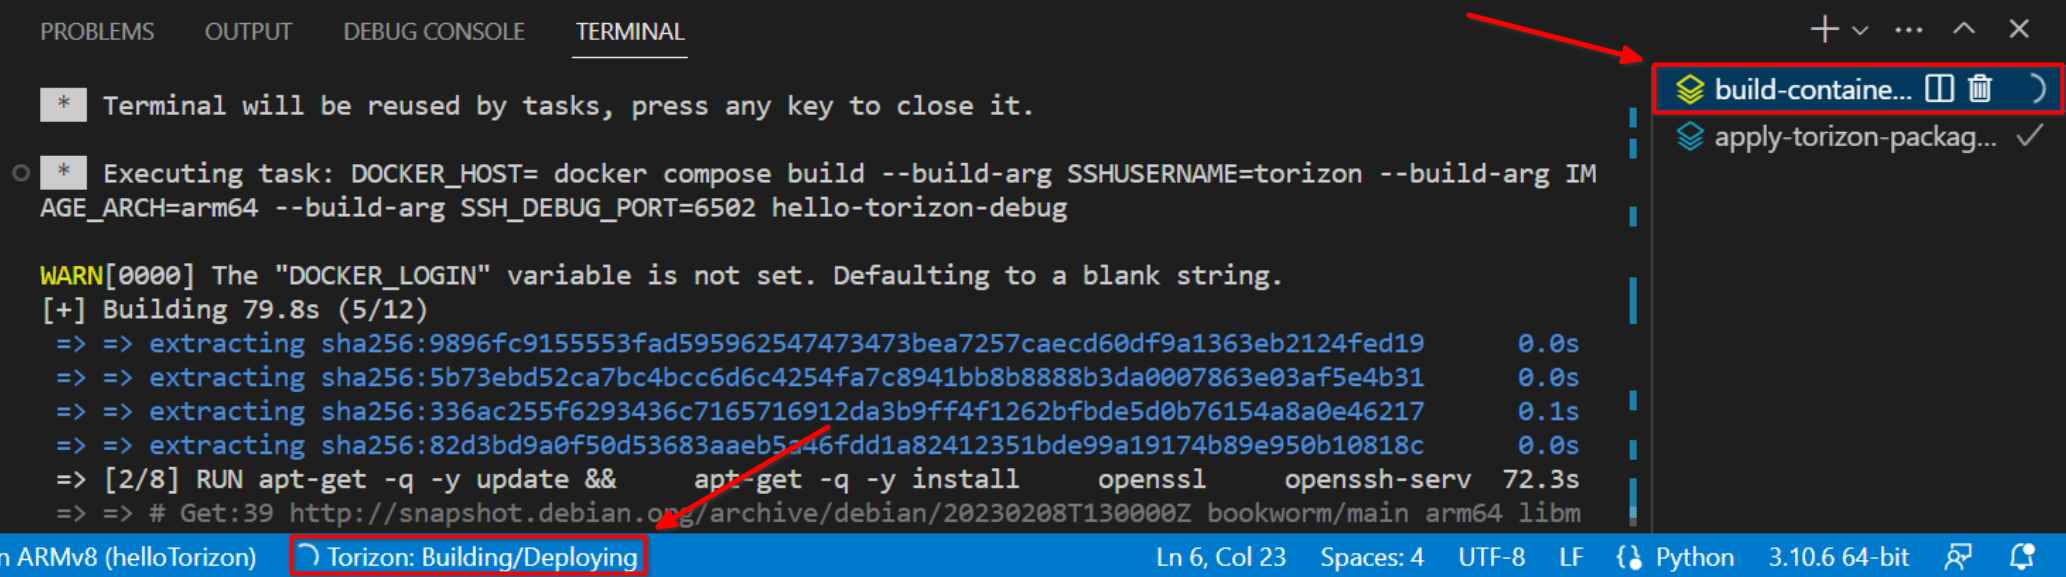
Wait for the process completion. The VS Code will automatically change to the
Debug Consoletab, where should have the output logs of the debugger and application.WarningBe patient. The first time you run the debug process, it may take a while to complete the image build. The time depends on the size of your project and the speed of your network connection.
Using Breakpoints
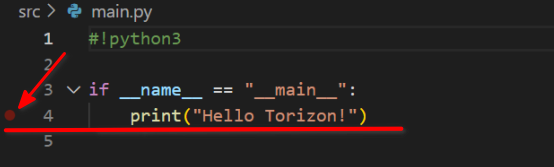
Add Breakpoints: The templates are not set up to break at the application's entry. Then, to debug your application, you need to set a breakpoint on the code.
Click on the left side of the line number where you want to set the breakpoint.
Run the debug process (press
F5): The application will start running and then stop at the breakpoint.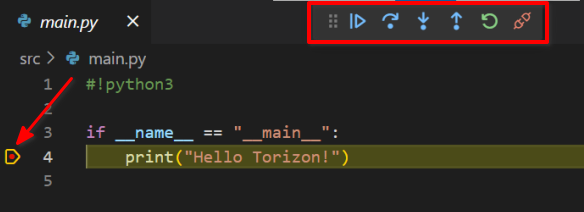
You can now use all the standard debugging features in VS Code to debug your application. See the VS Code Debugging documentation for more details.
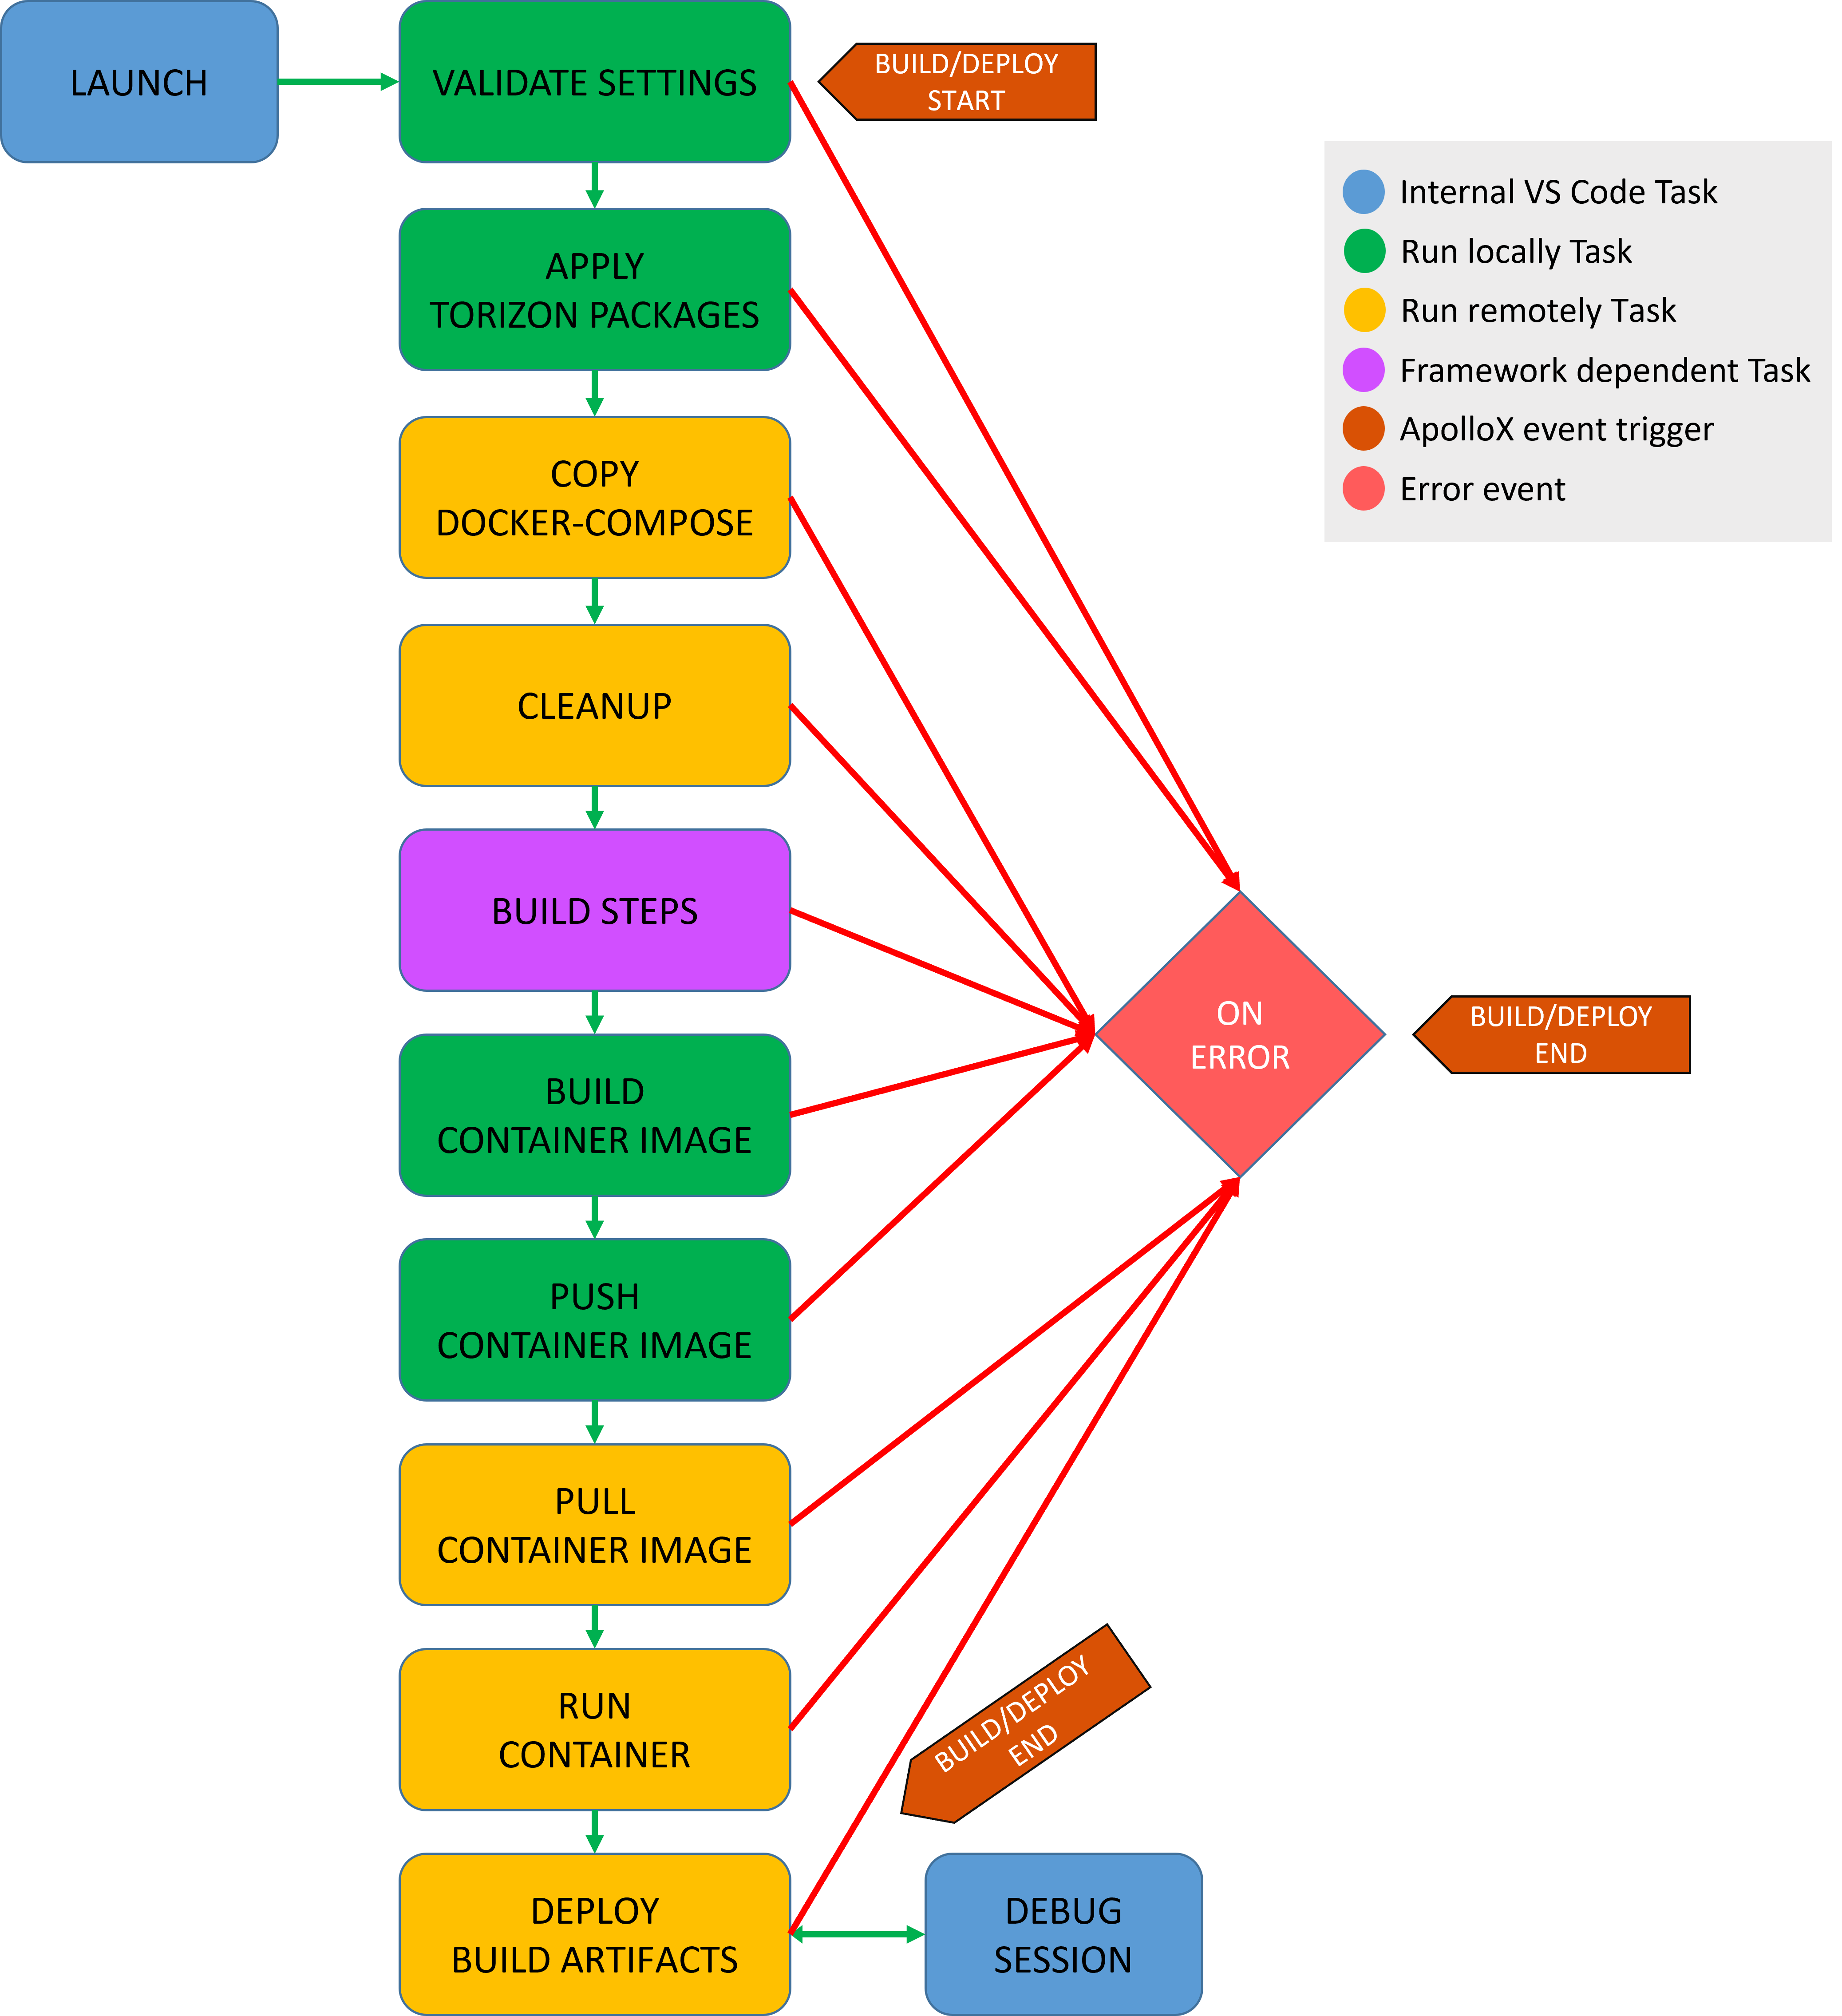
Deploy and Debug Tasks
The remote deploy and debug process runs a few tasks. This is the flow: