Build and Run the Amazon SageMaker Edge Manager Demo on Torizon
Introduction
This demo is a porting for TorizonCore of the original demo dlr-demo from NXP that demonstrates features of Amazon SageMaker Edge Manager and AWS IoT Greengrass V2.
The demo uses Amazon Kinesis Video Streams to display the real-time video feed of the detections and a Managed Grafana MLOps Dashboard.
This article complies with the Typographic Conventions for Torizon Documentation.
Prerequisites
- Configure Build Environment for Torizon Containers.
- Login the Docker engine to your dockerhub account using docker login.
- AWS account.
- Download and install the AWS CLI. Make sure to follow the Pre-requisites and to configure the CLI.
sshpasspackage. If not already installed, look for instructions on how to install it on your distribution.- Compatible hardware with TorizonCore:
- Maivin kit (recommended) or
- Verdin iMX8M Plus with a working camera, see How to use Cameras on Torizon.
Setup
This demo uses paid AWS services, so expect charges on your AWS account from setting it up.
Clone the Repository
Clone the repository to your machine:
$ cd ~
$ git clone -b aws-cloud-demo-video-kvs https://github.com/eercanayar/aws-cloud-demo-torizon
$ cd aws-cloud-demo-torizon
Configure the Project
Modify the project_settings.sh file:
AWS_REGION="us-east-2"
PROJECT_NAME="my-dlr-demo-torizon"
DOCKERHUB_LOGIN="docker-hub-login"
BOARD_IP="board-ip-address"
BOARD_PWD="board-password"
- Set your selected
AWS_REGION. - Set
PROJECT_NAMEwith a unique project name. - Set
DOCKERHUB_LOGINwith your dockerhub username. This will be used to push and pull containers to your board. - Set your
BOARD_IP. You can also use the hostname. - Set
BOARD_PWDwith the password for your board.
Install the Services in the Cloud
Use the setup_cloud_service.sh script:
$ ./setup_cloud_service.sh
It may take about 15 minutes to conclude.
Install the Credentials to the Device
Use the setup_device.sh script. This will install AWS IoT Greengrass on your Board's filesystem, with its credentials and certificates.
$ ./setup_device.sh
Run the Demo
Use the greengrass.sh script. This will start Greengrass Nucleus.
$ ./greengrass.sh
Check if Model is Loaded
It is necessary to wait for the model to be loaded before proceeding. Trying to view the output before the model is loaded causes problems that require the application to be restarted.
SSH Into the Board
Use SSH to connect to the board.
$ ssh torizon@<board-ip-address>
Attach a Terminal to the Running Container
# docker exec -it aws-cloud-demo-torizon bash
Find Edge Manager Camera Integration Name
Find the name of your edge manager camera integration, it will be in the format aws.sagemaker.<PROJECT_NAME>_edgeManagerClientCameraIntegration.log. If there is no log file for the camera integration, wait until there is one, this can take over a minute.
## ls /greengrass/v2/logs
aws.greengrass.LegacySubscriptionRouter.log  aws.greengrass.Nucleus.log  aws.greengrass.SageMakerEdgeManager.log  aws.sagemaker.my-dlr-demo-torizon_edgeManagerClientCameraIntegration.log  greengrass.log  main.log  my-dlr-demo-torizon-mobilenet-ssd-v2-coco-quant.log
Wait for the Model to Load
View the log and wait until you see that the model is loaded:
## tail -f /greengrass/v2/logs/aws.sagemaker.<PROJECT_NAME>_edgeManagerClientCameraIntegration.log
...
2022-09-12T18:01:11.011Z [INFO] (Copier) aws.sagemaker.my-dlr-demo-torizon_edgeManagerClientCameraIntegration: stdout. Model loaded..... {scriptName=services.aws.sagemaker.my-dlr-demo-torizon_edgeManagerClientCameraIntegration.lifecycle.run.script, serviceName=aws.sagemaker.my-dlr-demo-torizon_edgeManagerClientCameraIntegration, currentState=RUNNING}
Configure the Grafana Dashboard and AWS X-Ray (Optional)
If you do not wish to setup the Grafana MLOps dashboard and AWS X-Ray service map, skip to Video Output.
Prerequisites
To configure the Grafana MLOps dashboard and AWS X-Ray service map, you need:
- Running demo, after completing all previous setup steps.
- Grafana account.
X-Ray Setup
To setup the MLOps dashboard, first go to the corresponding folder in the repository:
$ cd ~/aws-cloud-demo-torizon/mlops-deployment
Publish X-Ray Daemon
Run:
$ ./001_publish_component_xray.sh
This publishes X-Ray daemon as a Greengrass component com.mlops.xray version 1.1.0.
Get the Latest Edge Manager Client Camera Integration Component Recipe
Run:
$ ./002_update_component_integration.sh
Which gets the latest edgeManagerClientCameraIntegration component recipe and deploy version 0.2.0 with following modifications:
- Adds
com.mlops.xray >= 1.1.0as a hard dependency - Updates version to
0.2.0 - Uploads one modified component source file to S3
- Updates source file URL
Attach Policy for AWS X-Ray
Run:
$ ./003_attach_policy_for_xray.sh
This allows Greengrass to write segments to X-Ray service.
Deployment
Run:
$ ./004_revise_deployment.sh
Which gets the latest deployment for the device, updates the component versions, includes the new com.mlops.xray and deploys X-Ray to the device.
Validate X-Ray Installation
On the terminal attached to the container, as was done in Check if model is loaded, verify that com.mlops.xray produces logs outputs as published segments:
## tail -f /greengrass/v2/logs com.mlops.xray.log
...
2022-06-18T22:00:11.054Z [INFO] (Copier) com.mlops.xray: stdout. 2022-06-18T22:00:11Z [Info] Successfully sent batch of 50 segments (0.149 seconds). {scriptName=services.com.mlops.xray.lifecycle.Run, serviceName=com.mlops.xray, currentState=RUNNING}
2022-06-18T22:00:12.022Z [INFO] (Copier) com.mlops.xray: stdout. 2022-06-18T22:00:12Z [Info] Successfully sent batch of 50 segments (0.147 seconds). {scriptName=services.com.mlops.xray.lifecycle.Run, serviceName=com.mlops.xray, currentState=RUNNING}
...
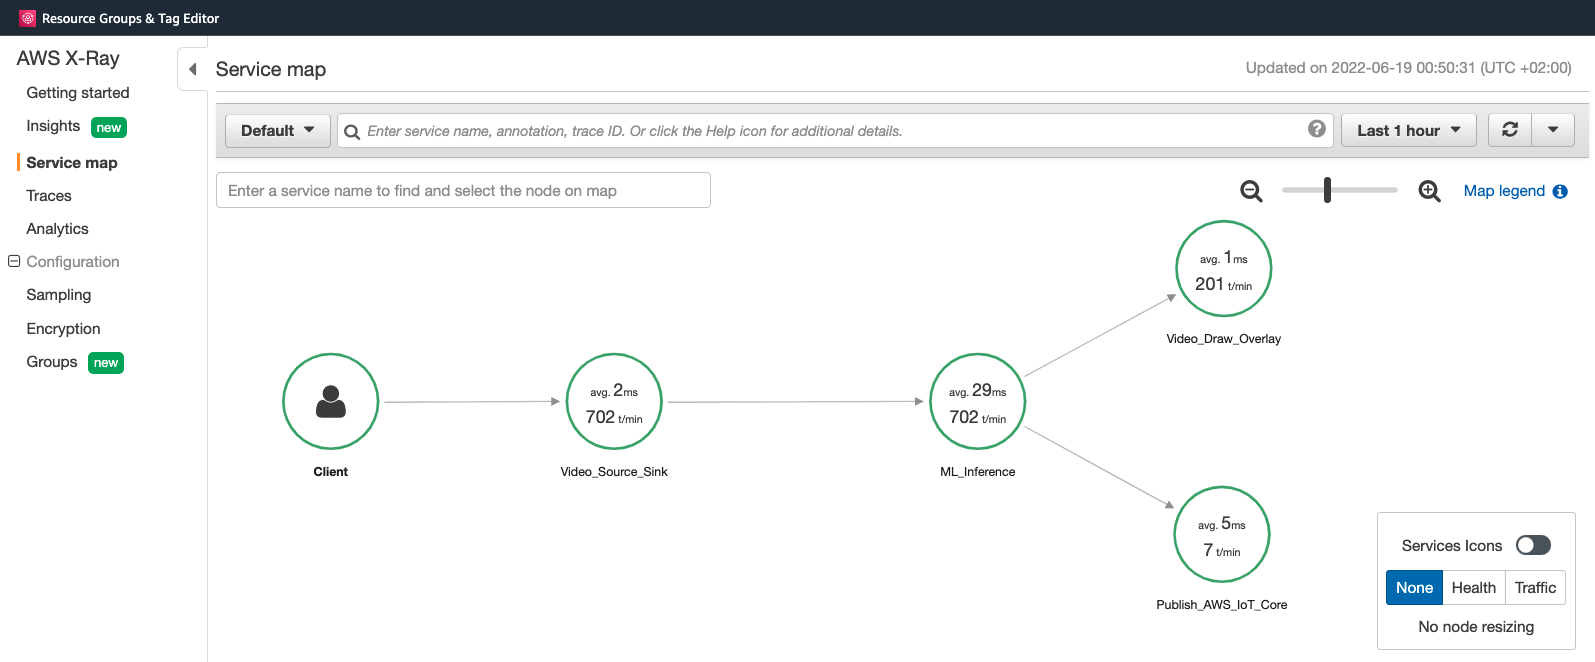
Also, you can go to the AWS X-Ray console and check if the Service Map is built for the last 5 - 10 minutes.

Grafana Dashboard Setup
You need to be logged in to your Grafana account for the following steps.
Create an Amazon Managed Grafana instance
- Create an Amazon Managed Grafana instance.
- Enable AWS X-Ray data source during installation. Make sure to add the X-Ray Grafana Plugin.
- Make yourself Admin on Grafana
Load the dashboard
- Login to Grafana instance with AWS IAM
- Go to Configuration > Data Sources and click "AWS X-Ray [Region]"
- Copy the
uidof data source from URL. It's the last section of the URL. For the URLhttps://g-a123456.grafana-workspace.us-east-2.amazonaws.com/datasources/edit/abcf12345/, theuidisabcf12345. - Replace all
arn:aws:xray:eu-west-1:123456789012occurrences ingrafana/dashboard_json_model.jsonwith your region and account ID:
$ sed -i 's/arn:aws:xray:eu-west-1:123456789012/arn:aws:xray:<aws-region>:<aws-account-id>/g grafana/dashboard_json_model.json
- Replace all
abcf12345occurrences ingrafana/dashboard_json_model.jsonwith youruid:
$ sed -i 's/abcf12345/<uid>/g grafana/dashboard_json_model.json
Observing the Results
Video Output
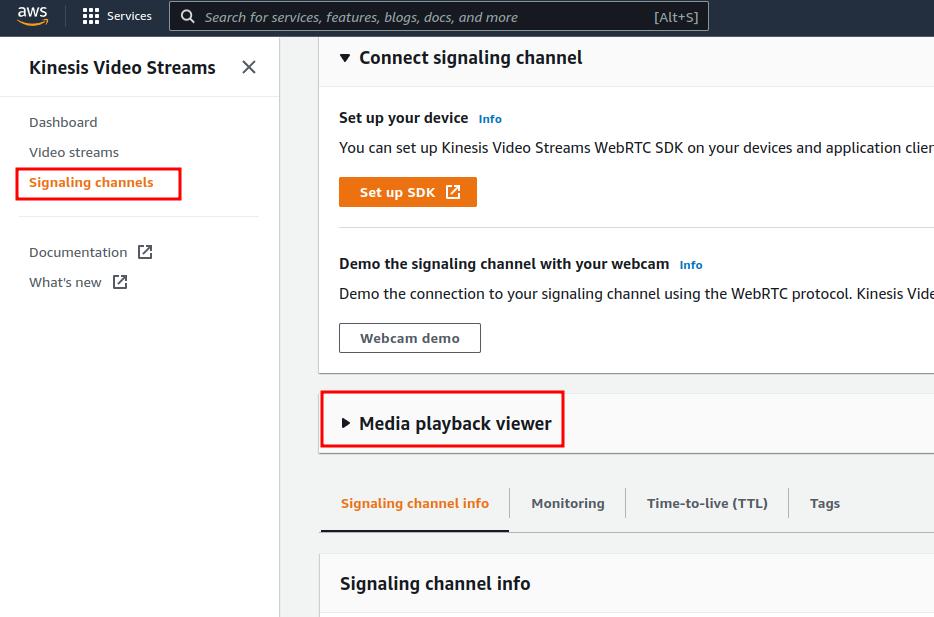
On AWS Management Console, go to Kinesis Video Streams, and use the playback view to see the video output:

Grafana MLOps Dashboard
In Grafana, go to Dashboards > Browse and click the Import button. Choose the file ~/aws-cloud-demo-torizon/mlops-deployment/grafana/dashboard_json_model.json to import.
At this point, the dashboard will be available.
Cleaning up Everything
This will delete all the things in your AWS account.
To wipe all things and deployments created on your account, use the python cleanup.py script.
Due to some possible interdependencies, you may need to run this script twice.
$ python3 cleanup.py