Memory Leak Detection (Windows CE)
Overview
Finding a Memory leak in applications and resource has always a pain for a developer in Windows CE, as we have limited RAM and resources. In order to detect resource leaks, Microsoft has provided an Application Verifier tool for WinCE6 and Resource Leak Detector tool for WEC7 and WEC2013. These tools assess the stability of an application/driver and identify common programming mistakes. The tool can detect and pinpoint memory leaks, handle leaks, and leaks in graphics device interface (GDI) objects. This tool can also detect some forms of heap corruption.
Resource leak detector will be installed along with Windows Embedded Compact platform builder in Visual Studio.
Testing an application with Resource Leak Detector
Please go through the instructions below to test for memory leaks (VS2008 or VS2012 or VS2013 or VS2015).
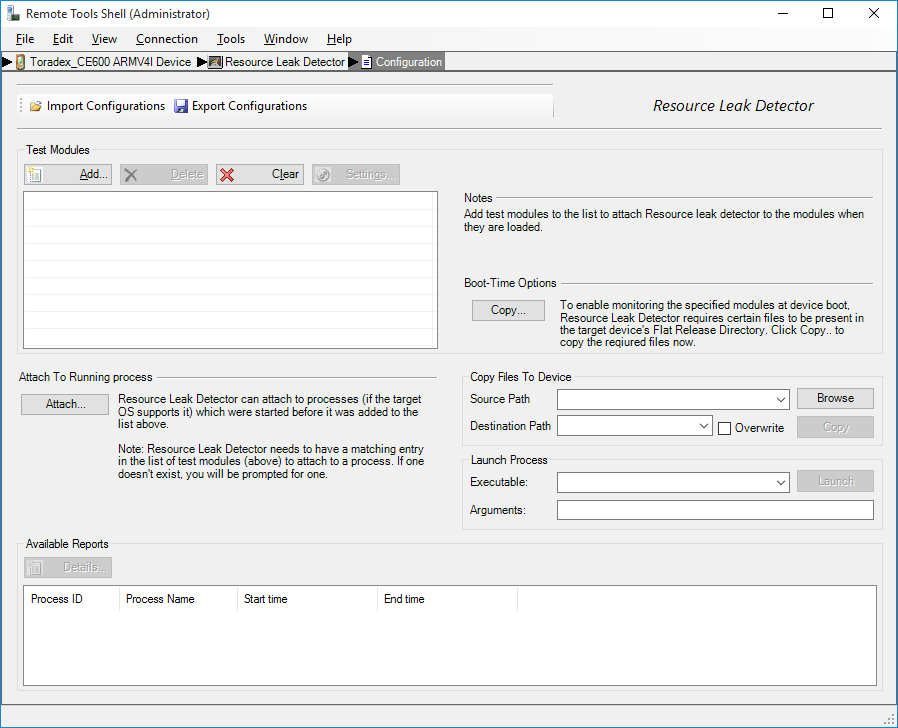
In VS2008 click on Tools menu, select Remote Tools, and click Resource Leak Detector to bring up the Connecting to Device screen in order to establish the connection with the target device. Once the connection is established, the Remote Tools Shell screen comes up with the Resource Leak Detector active, as shown in the image below. If the Connecting to Device screen does not pop up then click File > Collect Live Data > Resource Leak Detector.
Make sure Windows CE device is powered ON and Active Sync is connected.
Deselect all and select only the connected SDK, ex: Toradex_CE600 ARMV4I Device.
 .
.
From the Test Modules pane, click Add to bring up the Test Settings screen, as shown in below figure.
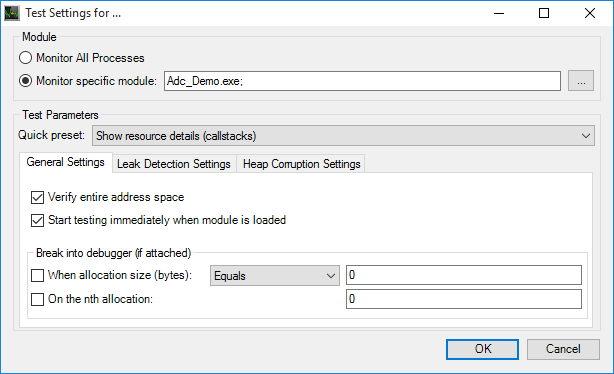
From the Module pane on the Test Settings screen, select the Monitor Specific Module option. Click the file selection button on the right to select the intended application ex: AdcDemo.exe. On the same Module pane select drop down Quick Preset and choose Show resource details (call stacks). Click OK to close the screen.
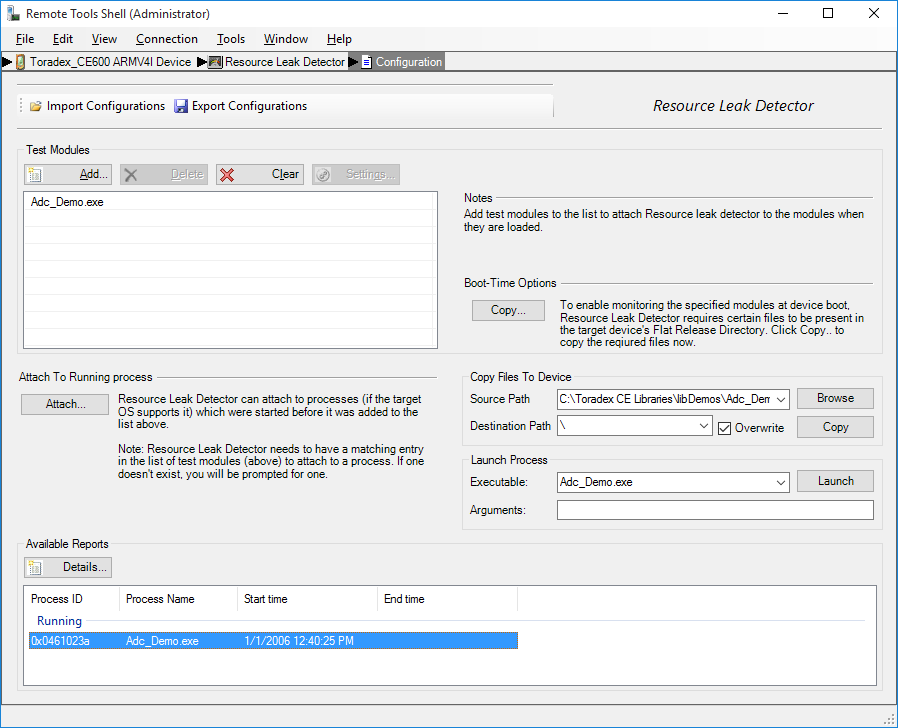
After the Test Settings screen closes, the AdcDemo.exe module is listed on the Test Modules pane of the Remote Tools Shell screen.
Deploy the application and execute it.
At this point, the Available Reports pane on the Remote Tools Shell screen lists the Adcdemo.exe process as one of the available reports, as shown in the figure below;
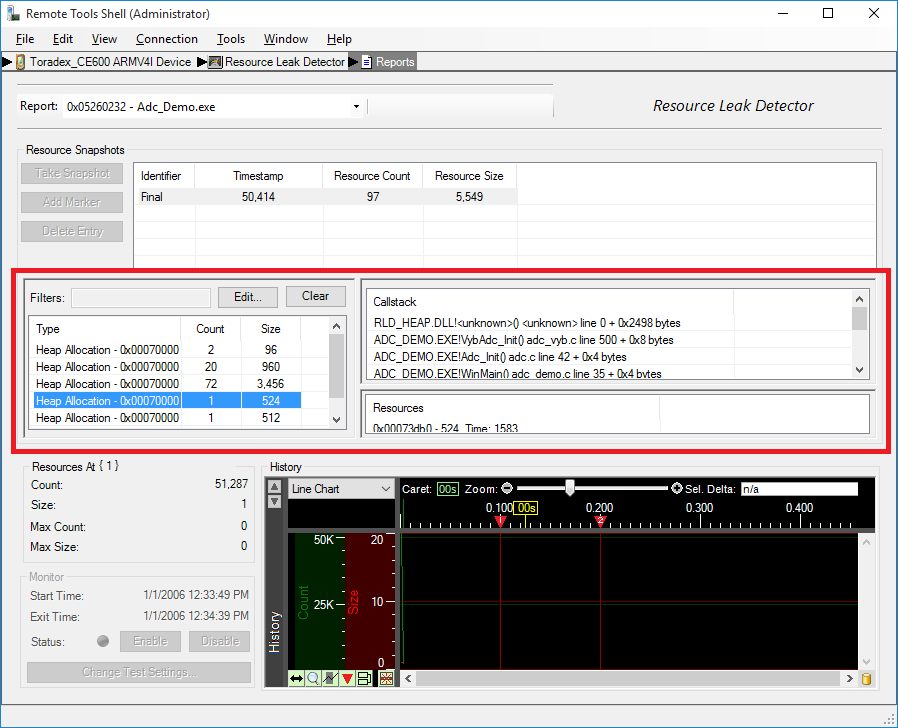
- Wait for the Application to terminate and double-click the adcdemo.exe process to open the report in the analysis window, as shown in the figure below;
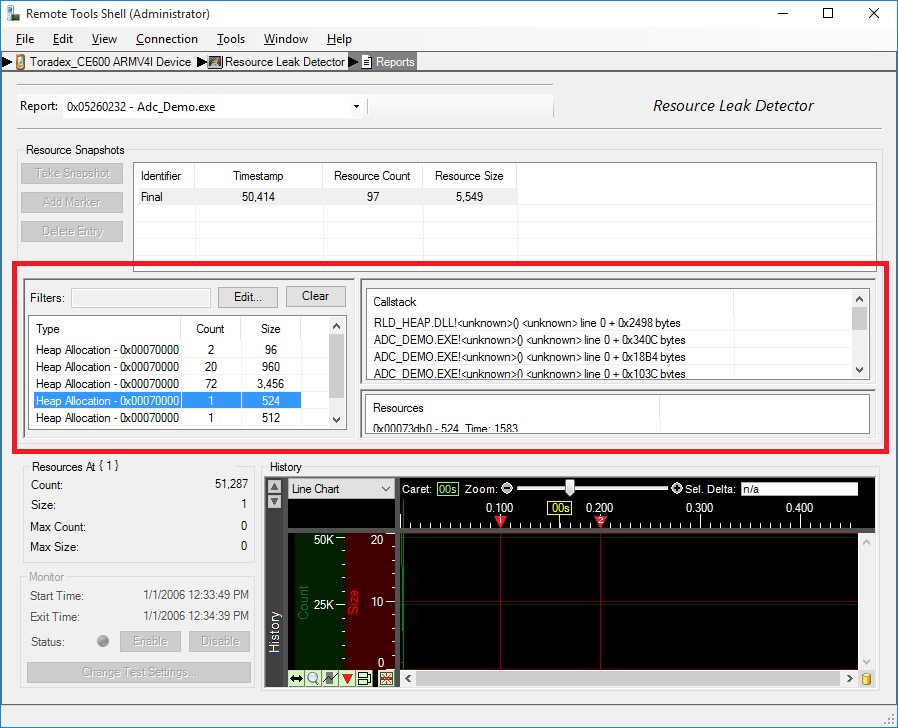
Any detected leaks appear in the middle pane, just above the Resources and History panes.
Build the application with program database file and MAP file and input the path to the Resource Leak Detector by clicking Tools > Symbol lookup paths > Add. (With this option you would be able to see details about which allocated memory was not freed)
Active sync is not supported on WEC2013. Use Ethernet interface for connecting with resource leak detector. Manually start the debugger on the module via Start > Programs > ColibriTools > Start Debugger client. The Resource Leak Detector will ask you for the IP of the module.
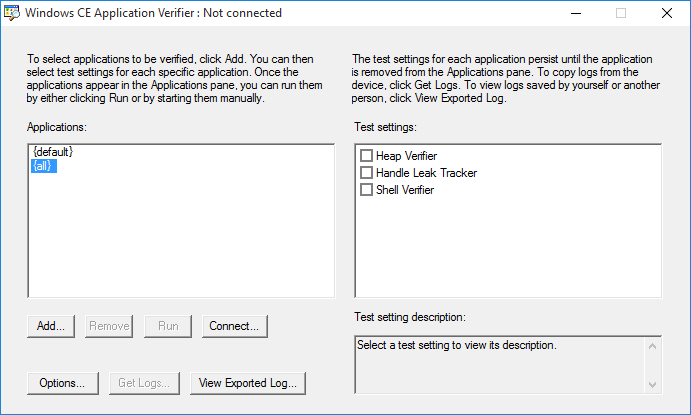
Testing an application with Application Verifier (WinCE6)
Install Windows Embedded CE 6.0 Test Kit
On Windows 7 you will get a compatibility warning. Select Install Anyway to continue the processRun appverifce.exe from C:\Program Files (x86)\Microsoft Platform Builder\6.00\CEPB\wcetk\ddtk\desktop.
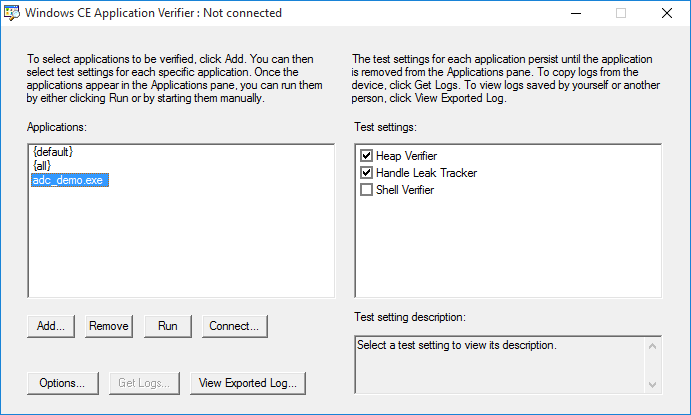
- Add the intended application to detect memory leaks by clicking the Add button ex: Adc_Demo.exe and select the Intended Settings.
Copy appverif.exe, verifhlp.dll, shimheap.dll, shim_hleak.dll, shim_verifier.dll, shim_usergdi.dll from “C:\Program Files (x86)\Microsoft Platform Builder\6.00\CEPB\wcetk\ddtk\armv4"_ to the device root directory.
Copy the application to the device root directory.
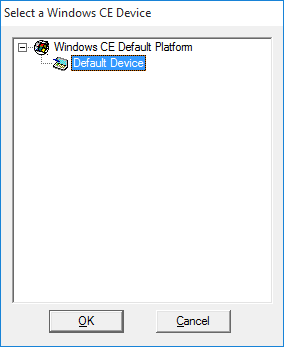
Click Connect > Settings > Select Default Device > Properties > Transport as Microsoft ActiveSync. Select Startup server as Microsoft ActiveSync. Click OK to exit from Device properties. Click OK to exit from Windows CE Platform Manager configuration.
Click Connect > Default Device > OK. Make sure it is connected to the device.
1. If you are not able to connect, please try disabling your antivirus and firewall protection.
2. If you encounter any Active Sync error while connecting to device and unable to connect, please follow these steps:
- Create a new folder "armV4" in C:\Program Files (x86)\Common Files\microsoft shared\Windows CE Tools\Platman\target\wce600
- Copy all the contents of the folder "armV4i" in newly created folder "armV4"
- Leave the folder "armV4i" intact.
Select the application and run, and wait till the application exits. Application Verifier will automatically generate test results only when the process exits.
Click Get Logs and select the folder to export the log.
Build the application with program database file and MAP file. It will be in Configuration Properties > Linker > Debugging.
Click View exported log and select the log file to see the results. Input .pdb and .map file path.
You can view the results of a test in the Windows Embedded CE Application Verifier window.