Silverlight GUI examples
For general information see our Microsoft Silverlight (XAML) Article.
This article aims to demonstrate the use of Silverlight for Windows CE on Toradex Computer Modules.
Development Environment for Silverlight
To understand how to setup the development environment for Silverlight click here.
NOTE: To run Silverlight application, the OS image must be built with Silverlight. To learn more click here.
You can also download the Silverlight .cab installer from here, which will install the necessary components required to support Silverlight for Windows Embedded on the image. Please note, if you want to use Silverlight in your device you have to buy WinCE professional license.
Use cases are:
- Industrial HMI
- Panel PC
- Dashboard for vehicles
- Home Automation
- and many more.
Control Panel with Gauges, Buttons and Indicators
Hardware setup
- On Colibri Evaluation Board V3.1A connect Outputs (SODIMM_73, SODIMM_86, SODIMM_88 and SODIMM_90) to LED 1, 2, 3 & 4 and Inputs (SODIMM_133, SODIMM_127, SODIMM_129 and SODIMM_131) to Switch 1, 2, 3 & 4 on X21 connector.
- Connect analog signal to ADC channel 2 (SODIMM_4) on X14 header of Colibri Evaluation Board V3.1A.
Demo Application
- Download demo source code from here & Expression Blend Design files from here.
- Open the project in VS2008. Build and deploy, after deploying the program to the device go to My Device > Program Files > SL_VirtualControlPanelDemo and run SL_VirtualControlPanelDemo.exe.
- Temperature gauge display the analog value received from ADC Channel 2 and Pressure gauge shows dummy values.
- Output LEDs can be switched ON/OFF by Buttons and ON/OFF status of input switches are reflected on indicators.
Two buttons are switched ON, the respective LED glows.
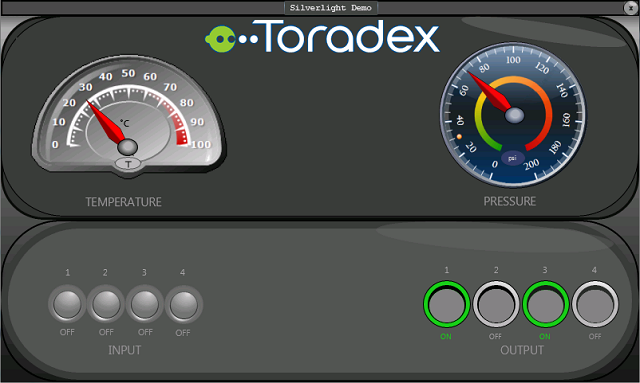
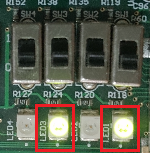
LED 1 and 3 glows.
Two switches are ON, the respective indicator in the UI glows.
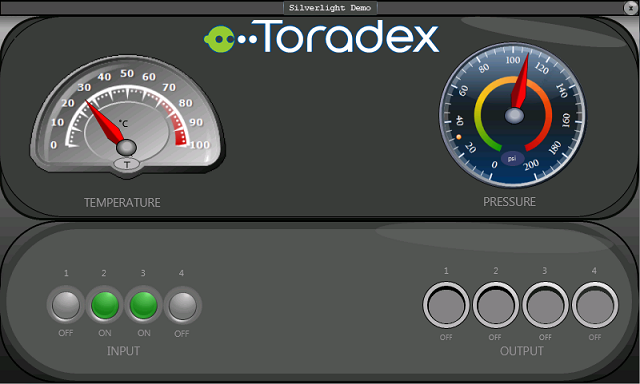
Switch 2 and 3 are "ON".

Graph Plotting in Silverlight
Hardware setup
- Connect Analog signal(Temperature Sensor LM35 Circuit) to Analog input pin(SODIMM_4) on X14 header of Colibri Evaluation Board V3.1A.
Demo Application
In the demo application, readings acquired from temperature sensor are plotted on the graph.
- For first demo Application - download source code from here & Expression Blend Design files from here.
- For second demo Application - download demo source code from here & Expression Blend Design files from here.
- Open the project in VS2008. Build and deploy, after deploying the program to the device go to My Device > Program Files > SL_TemperatureGraphPlotting and run SL_TemperatureGraphPlotting.exe.
- Pointer position slider controls the position of the pointer. The pointer points to a sample on the graph whose value is shown in the temperature text-box.
- Similarly, the sample scale slider controls the sample scale. Minimum and Maximum temperature recorded is also displayed.
Position of the pointer and sample scale is changed using Slider control.
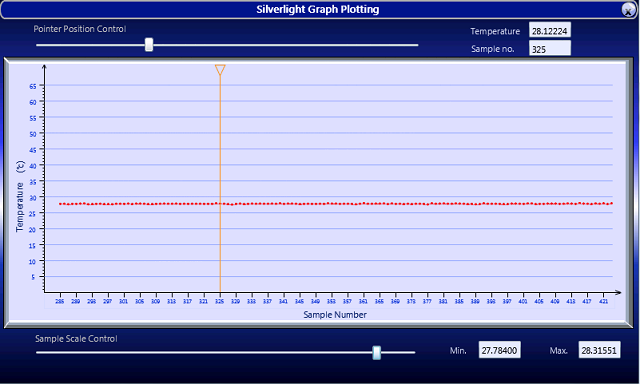
Compelling UI can be created in Silverlight and the visuals of the application can be designed according to the requirement. For example above application design is modified to provide different visual as shown in picture below.

Radial Gauges, Switches and Indicators
Hardware setup
- No hardware connection required in this demo, gauges/buttons/indicators are dummy to show possibility of different types of controls in Silverlight.
Demo Application
- Download demo source code from here & Expression Blend Design files from here.
- Open the project in VS2008. Build and deploy, after deploying the program to the device go to My Device > Program Files > SL_GaugeAndButtonDemo and run SL_GaugeAndButtonDemo.exe.
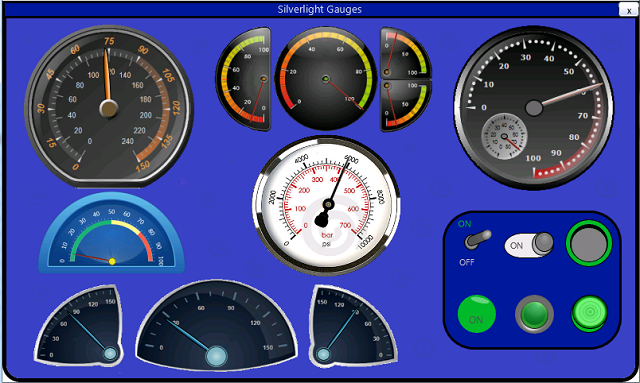
- Silverlight provide a feature to use different type of Radial Gauges, switches and Indicators in application. An example is shown in picture below.
All switches are ON
